Tolerance Stackup is a methodology used in industries to determine how the cumulative tolerance of parts affects the whole assembly. By using Tolerance Stackup Analysis, we can find the best way to balance the tolerances in parts, lowering the cost of making it and that also ensures that the part fits in the assembly even in the worst-case scenario.
In this article, we will learn more about tolerance stackup analysis and different types of tolerance stack ups with examples.
What is Tolerance Stackup Analysis?
The process of determining the effects of the cumulative variation permitted by given dimensions and tolerances in parts or assemblies is known as “Tolerance Stack up” or “Tolerance Stacking“. In engineering drawings, tolerances are mentioned against dimensions if that dimension is critical to quality (CTQ).
The maximum and minimum distance (clearance or interference) between two features or parts can be determined using tolerance stackup analysis. That helps engineers to figure out if the part can be assembled freely or not.
Importance of Tolerance Stackup Analysis
Without tolerances, it is economically impossible to produce parts that closely match. The rejection rate and production costs can go up with tight tolerance. However, a product’s functionality may be impacted by loose tolerance. Determining optimized tolerances is therefore always advised.
Nothing can be 100% accurate. Even machines can not produce 100% accurate parts. So basically, 100% accurate is just a theory. In practice, it is impossible to achieve 100% accuracy.
That is why tolerance is very important. If you put tight tolerance, the part cost goes up as manufacturers have to set up special machines to achieve that tight tolerance.
If you put loose tolerance, the part cost may be less, but it may hamper the function of the part. So it’s a trade-off between the accuracy and the quality of the part.
Types of Tolerance Stack up Analysis
There are many types of tolerance stackup analysis adopted by manufacturers across the world. But out of that, the following two types of Tolerance Stack Up Analysis are very popular.
- Worst Case Tolerance Stackup Analysis
- Statistical Tolerance Stackup Analysis
Worst Case Tolerance Stackup Analysis
Worst case tolerance stackup analysis assumes that all dimensions are measured at their worst case maximum or worst case minimum. This methodology calculates tolerance stackup using a worst-case scenario. So in other words, even in the worst-case scenario, a part will always fit into the assembly, no matter how out-of-spec the part is.
That is the reason, there is almost no rejection if we do tolerance stack up using the worst-case method.
The Absolute Worst Case Tolerance Stackup Analysis is a well-established technique for calculating the stack up. For example, setting all tolerances to their maximum allows a measurement to be as large or small as feasible.
No statistical probability is used in this process; instead, the product’s specifications are used as a guide. As a result, the Worst Case Model is designed to estimate the largest possible deviation of a given measurement. Every component should be designed to be able to assemble and work as intended, even if it is never assembled to the greatest extent possible.
Worst Case Tolerance Stackup Analysis Example
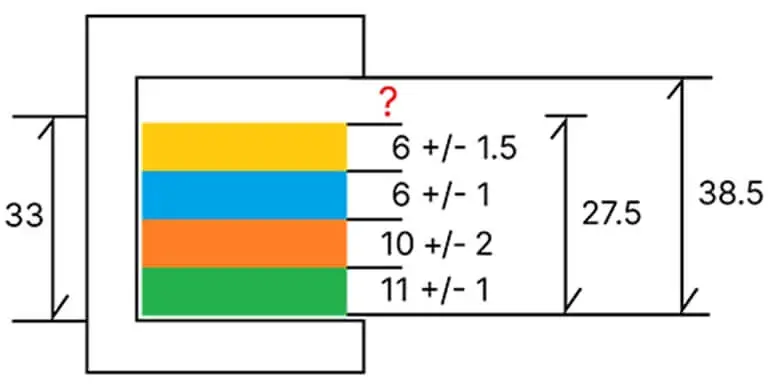
Let’s look at the below image. We will analyze the worst case gap (?) and the worst case tolerance using the Worst case tolerance stackup analysis. The same gap we will analyze using other methods in the late part of the article.

Maximum Height Of Individual Blocks When The Height is At Worst Case Maximum
- Green Block: 11+1 = 12
- Orange Block: 10+2 = 12
- Blue Block: 6+1 = 7
- Yellow Block: 6+1.5 = 7.5
Total Height Of Blocks When All Blocks Height Are At Worst Case Maximum (A): 12+12+7+7.5=38.5
Minimum Height Of Individual Blocks When The Height is At Worst Case Minimum
- Green Block: 11-1 = 10
- Orange Block: 10-2 = 8
- Blue Block: 6-1 = 5
- Yellow Block: 6-1.5 = 4.5
Total Height Of Blocks When All Blocks Height Are At Worst Case Minimum (B): 10+8+5+4.5=27.5
Total Upper Tolerances Of All Blocks (C): 1+2+1+1.5=5.5
Total Lower Tolerances Of All Blocks (D): 1+2+1+1.5=5.5
Total Maximum Height Of All Blocks = A+C=38.5+5.5=44 ( Means 4 blocks cannot be accommodated if the dimensions are at the maximum range as the available space is only 38.5
Total Minimum Height Of All Blocks= B-D=27.5-5.5=22
The Gap (?)= 38.5-22=16.5 (This gap will be available only if all the other blocks are produced at the lower limit of the tolerance value)
Properties of Worst Case Tolerance Stackup Analysis
- Based on the tolerance parameters assigned, this method represents the greatest possible variation in an assembled product.
- It is assumed that all components in an assembly process are at their maximum deviation at the same moment (in reality, this situation rarely happens as very often, one feature deviates at maximum and the other features are not)
- In this procedure, all parts must first be inspected individually to ensure that no item is out of tolerance.
- Only suitable for low-volume production parts
- Low rejection rates as the parts are produced considering the worst-case scenario.
Advantages of Worst Case Tolerance Stackup Analysis
- Worst-Case Tolerance Stack-up Analysis guarantees that all parts are assembled on the factory floor.
- In Worst Case Tolerance Stack-up Analysis, there is almost no rejection rate.
Disadvantages of Worst Case Tolerance Stackup Analysis
- Worst-Case Tolerance Stack-up Analysis needed precise individual component tolerances, which increases production and inspection costs.
- Worst case tolerance stackup analysis assumes that all parts are produced at worst case dimensions which are not practical.
- This method is not suitable for high-volume production parts.
Statistical Tolerance Stackup Analysis
Worst Case Tolerance analysis assumes that dimensional variation in parts follows a linear pattern. But in reality, each dimension in a part follows a unique distribution.
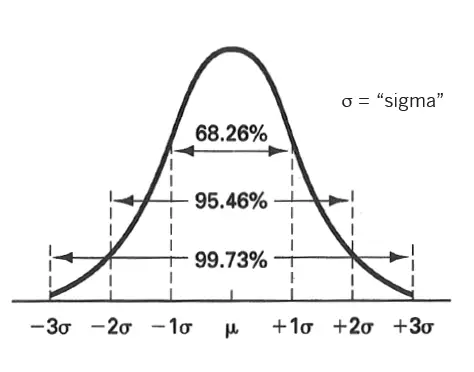
Definitely, the dimensional variation won’t cross the upper and lower tolerance limit. But the variation won’t be the same always. That is why normal distribution and bell curve comes into the picture and that is what Statistical tolerance analysis is all about.
A statistical tolerance analysis determines the predicted variation of an important output by using the fluctuation of a set of input variables.

There are two types of statistical tolerance analysis available in the industries.
- RSS Tolerance Stackup Analysis
- Monte Carlo Simulation Tolerance Stackup Analysis
In this article, we will only discuss the RSS tolerance stackup analysis method.
RSS Tolerance Stackup Analysis
RSS (Root sum of squares) tolerance stackup analysis method is one of the most widely used methods for tolerance stackup. This method considers the variation in the part based on the process capability index of the manufacturing process rather than just assuming that the dimensions will be either worst case maximum or worst case minimum.
RSS Tolerance Stackup Analysis Example
Let us take the same example that we discussed before and see how RSS Tolerance Stackup addresses the variation in the part and improves the tolerance.

Total Nominal Height= 11+10+6+6=33
Total Upper Tolerance= 1+2+1+1.5=5.5
Total Lower Tolerance=1+2+1+1.5=5.5
Now let us consider that the process capability index (CpK)=1 for the manufacturing process that is manufacturing those blocks. For those who do not understand what is meant by the Process Capability Index, it is an index that predicts how good the manufacturer is in meeting the dimensional specification that you have shown on the drawing.
We also consider that the supplier is capable of meeting only 3σ.
Standard Deviation for 3σ= Total Tolerance /(2X3) [Considering the fact that the process is capable of 3σ and equally distributed to both sides of the bell curve)
The standard deviation of the green block σ1= (1+1)/(2X3)= 0.33
The standard deviation of the orange block σ2= (2+2)/(2X3)= 0.66
The standard deviation of the blue block σ3= (1+1)/(2X3)= 0.33
The standard deviation of the yellow block σ4= (1.5+1.5)/(2X3)= 0.50
The standard deviation of the assembly (σ)=√ [(σ1)2+(σ2)2+(σ3)2+(σ4)2]= √ [(.33)2+(.66)2+(.33)2+(.50)2]=.9504
Total Tolerance Zone= 3σ (Since the supplier of capable of 3σ)= 3*.9504= 2.85
Maximum Height= Total Nominal Value+ 3σ Tolerance Value=33+2.85=35.85
Maximum Height= Total Nominal Value- 3σ Tolerance Value=33-2.85=30.15
Maximum Gap= 38.50-30.15= 8.35
Minimum Gap= 38.50-35.85= 2.65
As you can see, in the worst-case method if the blocks were produced at the upper limit, there was no gap at all. But in the RSS tolerance stack up analysis, there is always a gap. That means the RSS method gives a better understanding of what the tolerance should be and how it will affect the assembly.
Advantages of Statistical Tolerance Stackup Analysis
- The stackup analysis will be more accurate as it considers the actual variation of the manufacturing process rather than the worst-case scenario.
- The part will have tight tolerance and better quality unless the process capability index of the manufacturers goes bad over the period of time
Disadvantages of Statistical Tolerance Stackup Analysis
- Parts may go out of spec if the manufacturer can not hold the process capability index and sigma values go down. For example, if the tolerance stack up analysis was done considering 3σ, but in actuality, it is 2σ, then parts will be made out of spec.
- Continuous process control of the manufacturing process is required. Otherwise, there will be a rejection of parts.
- Since the variation of parts is depending on the variation of the assembly, 100% assurance is not possible that the part will always fit into the assembly.
Conclusion: Tolerance Stackup Analysis
Tolerance stack-up analysis is an effective tool for predicting the ultimate variation on key characteristics of an assembly before production begins. Estimating final variation allows for design modification and improvement to be made early in the design process, cutting down on product development expenses.
A proper examination of tolerance stack-ups must include allocation of tolerances. Since tolerance analysis and allocation involve repeated steps, the latter is only carried out once the final key characteristic’s variation is reduced to an acceptable level.
References:
- “Tolerance Analysis.” BrainKart, www.brainkart.com, https://www.brainkart.com/article/Tolerance-Analysis_5724/. Accessed 12 Aug. 2022.
- “Tolerance Analysis Methods, Platforms and Trends: Comprehensive Overview.” Tolerance Analysis Methods, Platforms and Trends: Comprehensive Overview, improvians.com, https://improvians.com/blogs/tolerance-analysis.html. Accessed 12 Aug. 2022.
- “Tolerance Analysis – Wikipedia.” Tolerance Analysis – Wikipedia, en.wikipedia.org, 1 May 2009, https://en.wikipedia.org/wiki/Tolerance_analysis.
- Vink, Jaap. “Statistical Stack-up Tolerance Analysis.” Vink System Design & Analysis, www.vinksda.com, 16 Dec. 2013, https://www.vinksda.com/statistical-tolerance-stack-up-analysis/.
- “Tolerance Stack-up Analysis, Its Benefits and Steps Involved in Mechanical Design – ASM Technologies Ltd.” ASM Technologies Ltd, www.asmltd.com, 10 Apr. 2017, https://www.asmltd.com/tolerance-stack-analysis-benefits-steps-involved-mechanical-design/.


