When thinking about a measuring instrument, it is important to understand all the parameters that make up the device’s characteristics. By knowing the accuracy and resolution requirements for your application, you can figure out the total error of the measuring device you are considering and make sure it meets your needs.
In this article, we will learn about the characteristics of an instrument with different types in detail.
There are two types of characteristics of instruments
- Static Characteristic
- Dynamic Characteristic
static characteristics of instruments
Some applications need to measure things that stay the same or change slowly over time. Under these conditions, it is possible to define a set of criteria that gives a meaningful description of the measurement quality without getting in the way of dynamic descriptions that use differential equations. These are known as static characteristics.
Types of Static Characteristics
Accuracy
Accuracy measures how close a measured amount is to its real or true value. To determine how well a measurement was done, you must compare the measured value to the true or standard value.
For example –, if you know that your real height is exactly 6’1″ and you measure it again with a measuring tape to be 6’1″, then your measurement is correct.
Precision
The precision of a measurement system is the degree to which its results (as measured by several samples) are consistent with one another, regardless of the real or true value. Comparing two or more remeasured data allows one to assess the reliability of a measurement system.
For example, if you know that your actual height is exactly 6’1″ and you measure it again with a measuring tape to be 6’1″, then your measurement is correct.
You may also like to read: Difference between Accuracy and Precision
Calibration
Any tool used to measure a quantity must be calibrated before the results can be converted to the reference unit. The calibration of a measuring device i6s is necessary before actual measurements are taken; typically, this is handled by the device’s manufacturer.
Calibration ensures that the instrument will produce a reading of zero when the input is zero and a reading of one hundred when the input is one hundred.
Sensitivity
Sensitivity is an instrument’s ability to detect small changes in a measured quantity. Under stable conditions, sensitivity is defined as the proportion of change in output to the change in input that causes it.
The name is typically reserved for “linear” devices, where the relationship between output and input magnitude looks like a straight line. You can also calculate sensitivity by seeing your instrument’s sensitivity to slight shifts in the measured quantity. The largest change in an input signal that does not trigger output is also referred to as the system’s sensitivity.
Magnification
Magnification is the multiplication of a measurement device’s output signal to make it more legible or apparent. In general, the bigger the magnification, the shorter the range of the device.
Scale Interval
The scale interval is the number of units between any two consecutive markings on a scale. As a result, we may assert that the instrument provides a reliable reading of the measured quantity.
Readability
The readability is the number of significant figures on the instrument scale. The more significant figures there are, the easier it is to read. The readability of an instrument depends on the following:
- Number of graduations
- Space between the graduations
- The size of the pointer
- The ability of the observer to tell the difference
Repeatability
Repeatability is the degree to which identical measurements taken by different people using the same equipment and in the same conditions yield consistent results.
Reproducibility
Reproducibility is the closeness of the results of measurements made on the same test material by different people using different methods and different instruments at different times, places, and conditions.
Discrimination
Discrimination refers to a measuring device’s capacity to detect slight variations in the monitored quantity.
Linearity
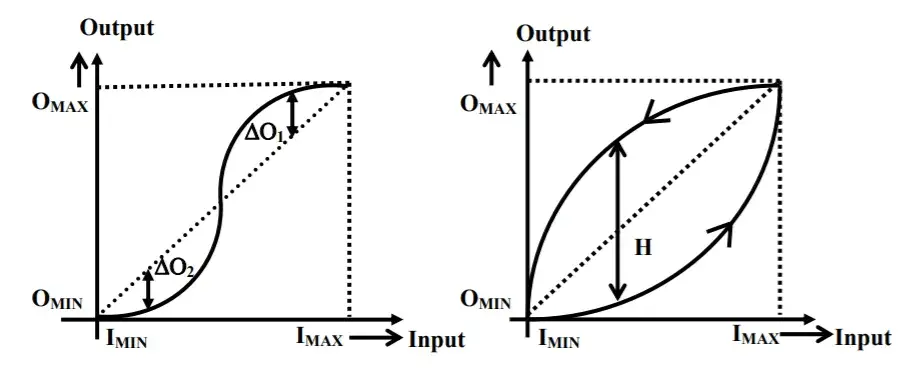
Linearity is the ratio of the maximum deviation from the linear characteristic as a percent of the full-scale output.

Hysteresis
Hysteresis is a phenomenon that shows how the output changes when something is loaded or unloaded. Often, as the values of the inputs go up, an instrument will show one set of output values. The same instrument may show different output values when the input value goes down.
Dynamic Characteristics Of Instruments
Dynamic characteristics of a measuring tool are when the thing being measured changes quickly. A control system’s sensors can’t react immediately to a sudden change in a measured variable.
Control system technology requires a certain amount of time before the measuring instrument can show any output based on its received input. How long it takes depends on the measuring tool’s resistance, capacitance, mass, and dead time.
Types of Dynamic Characteristics
Response Time
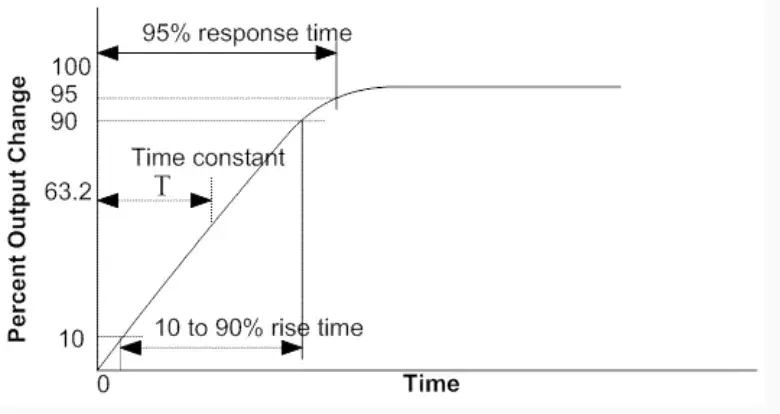
The time it takes for an instrument or system to reach a steady state after an input has been applied is known as its response time. The time it takes for an instrument to stabilize at a predetermined percentage of the amount for a step input function is called the response time.
Being measured after having had the input applied. Ninety to ninety-nine points something depends on the type of instrument. It is the amount of time it takes for the pointer on a portable instrument to scale the final length within +/-0.3% and for the panel-type switchboard to rest. The time it takes for the pointer to settle to within 1 percent of its final position on some instruments.
Step Response
Step Response is the amount of time it takes for a measuring device to go from measuring one steady step value to measuring another steady step value.

Dynamic Error
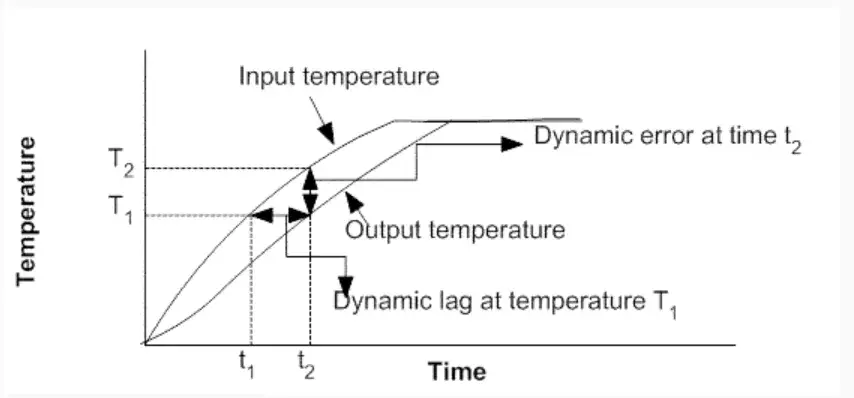
The dynamic error is the difference between the true value of the quantity that changes over time and the value shown by the instrument if no static error is assumed. When the instrument’s accuracy is added to the time delay or phase shift between the input and the output, we get the total dynamic inaccuracy of the instrument.
Ramp Response
The signal strength ramps up and down gradually over time. The input temperature was initially the head of the measured temperature, but the two eventually caught up. This chart displays the dynamic error and dynamic lag response curves.

Overshoot
Parts of instruments that move have mass, which means they have inertia. When an input is given to an instrument, the pointer doesn’t stop at its steady state (or final deflected) position right away. Instead, it goes past it or “overshoots” its steady position.
The overshoot is the most that a moving system can move away from its steady state position. Many instruments, especially galvanometers, need a little overshoot, but too much overshoot is not what you want.
Lag
When input changes, an instrument doesn’t respond quickly. Measuring lag is the lag in an instrument’s response to a change in the quantity being measured.
As a result, it is the delay in a measurement system’s reaction to changes in the amount being measured. While this lag is typically fairly small, it becomes crucial when high-speed measurements are needed. The time lag must be kept to a minimum in high-speed and dynamic measuring systems.
There are two types of lags
- Retardation Lag: In this measuring lag, the response starts as soon as the measured quantity changes.
- Time Delay Lag: With this measuring lag, there is an initial pause after input is applied before the measurement system starts responding.
Standard Signal
It is possible to use any input on the measuring systems. It is challenging to explain the actual input signals analytically by simple equations since the signals are typically random, and the type of input signals cannot be determined in advance.
Mathematical equations have been constructed for a few standard signals used to investigate the dynamic behavior of measurement systems. Common indicators are:(i) Step input, (ii) Ramp input, (iii) Parabolic input, and (iv) Impulse input.
These signals are used to study dynamic behavior in the time series, and the dynamic behavior of a system to any input can be predicted by studying how it reacts to one of the standard signals.
Fidelity
Fidelity is the ability of a system to make the output look the same as the input. It is the degree to which a measurement system shows changes in the thing being measured without any dynamic error.
If a linearly changing quantity is put into a system and the output is also a linearly changing quantity, the system is said to have 100 percent fidelity.
Conclusion: characteristics of instruments
We need to know the system characteristics to choose the one that is best for a certain measurement application. In real life, the characteristics of one group may very well affect the characteristics of the other. To find out how well an instrument works as a whole, however, the two groups of characteristics are usually studied separately, and then a semi-quantitative superposition is done.
References:
- 1. “Static And Dynamic Characteristics of Measuring Instruments | The Pro Notes.” The Pro Notes, 20 Mar. 2021, thepronotes.com/static-and-dynamic-characteristics-of-measuring-instruments/#Precision.
- 2. “Static and Dynamic Characteristics of Measurement.” BrainKart, www.brainkart.com/article/Static-and-Dynamic-Characteristics-of-Measurement_12810. Accessed 2 Sept. 2022.
- 3. “Static and Dynamic Characteristics of Instruments.” Static and Dynamic Characteristics of Instruments, 10 May 2020, instrumentationapplication.com/static-characteristics-and-dynamic-characteristics-of-instruments.
- 4. “Static Characteristics – Gauge How.” Gauge How, 20 Mar. 2020, gaugehow.com/lesson/static-characteristics.
- 5. “Static Characteristic – an Overview | Science Direct Topics.” Static Characteristic – an Overview | Science Direct Topics, www.sciencedirect.com/topics/engineering/static-characteristic. Accessed 2 Sept. 2022.


