Process Capability Index ( CpK) is a very important statistical analysis tool to determine the current capability of a manufacturer in meeting customer requirements and the future prediction of how that process will be capable of meeting the specification.
Let us learn more about Process Capability Index in this article. We will also learn about how to calculate the process capability index.
But before that, let us learn what is Process Capability and what is the importance of Process Capability in a system
What Is Process Capability?
Process capability compares the output of an in-control process against the specification limit set by the customer. Process capability gives an indication that the process is capable/ not capable enough to meet the specification
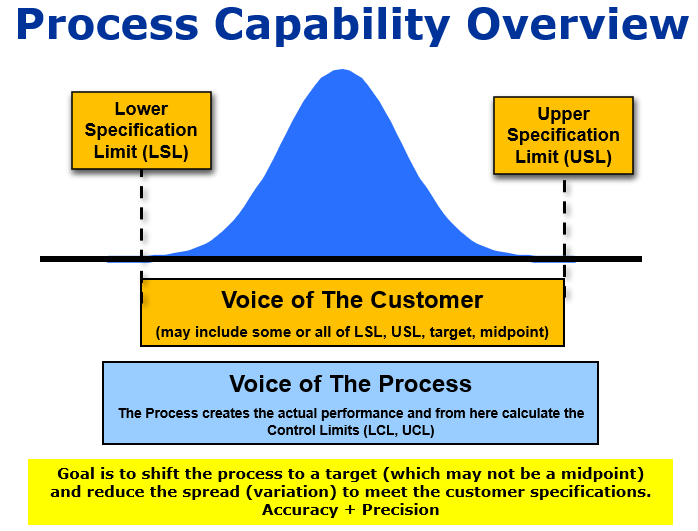
The repeatability and consistency of a production process with client need in terms of specification limits of a product parameter is known as process capability. This metric assesses the degree to which your process satisfies or fails to satisfy the requirements.
Importance of Process Capability
Every company or process owner wants their output to have the highest possible value, consistency, minimal rejection, maximum yield, fewest possible breakdowns, and longest possible life span.
Knowing and assessing the performance of a manufacturing process is made possible through monitoring its capabilities. Once the process has been assessed, any necessary changes can be made to ensure the final products follow the specifications laid out in the design documents or by the individual customers.
Using capability indices (Cp, Cpk, Pp, and Ppk), we can get insight into the process capability and take measures to lessen waste, boost product quality, and consistency, and cut production costs.
What is Process Capability Index (CpK)?
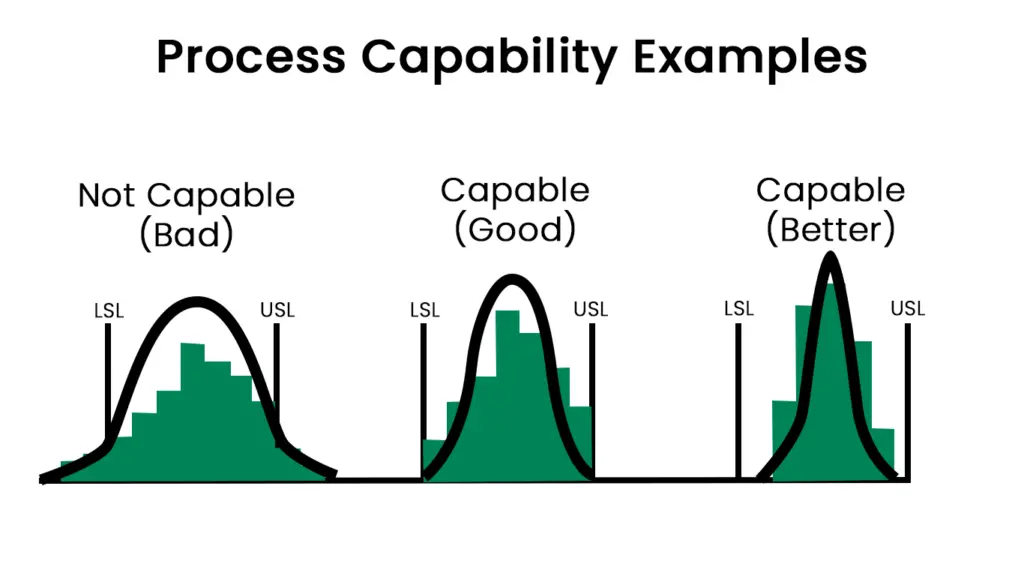
The Process Capability Index (Cpk) index measures a process’s ability to consistently provide products that fall within the bounds set by the customer’s specifications. It’s a measure of the manufacturer’s ability to consistently provide goods that are within the quality standards set by the customer.
Process Capability Index measures how consistently you perform around an average value, giving you an idea of how near you are to a goal. The CpK calculation returns the optimal state of the process at present. Under the assumption of a constant rate of improvement, it can also predict how well a process will do in the future.
How does a Process Capability Index (CpK) Work?
CpK is used to determine how close the process is to a given target and how the variation is spread from the mean. CpK can determine the best case scenario of a given process.
CpK can also help in predicting the future performance of the process, considering that the performance is the same over time.
Cpk is used to estimate how close you are to a given target and how consistent you are around your average performance. Cpk gives you the best-case scenario for the existing process. It can also estimate future process performance, assuming performance is consistent over time.
if the CpK value is high, that is an indication that the process can meet the specification. If the CpK value is low, then it is an indication that there are more variations in the process, and it may not meet the set specification.
CpK has a direct relationship with Standard Deviation. If the standard deviation is low, the CpK value will be high and vice versa.
| CpK | Process Yield |
| 0.5 | 86.8% |
| 0.8 | 98.4% |
| 1.0 | 99.7% |
| 1.2 | 99.97% |
| 1.33 | 99.99% |
How to Calculate the Process Capability Index?
If you know the Upper Specification Limit(USL) and the Lower Specification Limit(LSL) of a process, then you can easily calculate the Process Capability Index using the following formula.
Cpk = min [{(USL−μ)/ 3σ} , { (μ−LSL) / 3σ)}]
Where,
Cpk = Process capability index
USL = Upper specification limit
LSL= Lower specification limit
σ = Standard deviation
μ= Mean
Let us take an example to calculate the process capability index.
Consider that a process has a USL=16 and LSL=4. What will be the process capability index for that process?
Here,
USL=16
LSL=4
Mean (μ) =( USL+LSL)/2=(16+4)/2=10
Standard Deviation (σ)= 2 ( You can calculate the Standard Deviation using the formula shown later in this article.
Cpk = Min [{(USL−μ)/ 3σ} , { (μ−LSL) / 3σ)}]
= Min [{(16-10)/6}, {(10-4)/6}]
= Min [1,1]
= 1
You can calculate the standard deviation using the following formula

 = sample standard deviation
 = sum of…
 = each value
 = sample mean
 = number of values in the sample
Difference Between Cp And CpK
Cp ensures that the process is meeting the specification and CpK shows how close the data is to the mean. For example, if the overall data average is near the mean then the Cp and Cpk value will be the same.
But if the Cp and the Cpk value are different, then it means that the process may be meeting the specification but there is too much variation in the process. That is why CpK is more important as it shows the variation in the process.
Let us understand the principle with an example.
Let us consider that the USL of a process is 10, and the LSL is 4. If the measured data point for five samples is 5,6,7,8,8, and 9 then we can say that the process is capable of meeting the standard as the measurement is in between USL and LSL
| Measurement | Value |
| 1st Sample | 5 |
| 2nd Sample | 6 |
| 3rd Sample | 7 |
| 4th Sample | 8 |
| 5thh Sample | 9 |
But as you can see that the variation of measurement is too much from 5 to 9. So the CpK value will be low and there are high chances that in the future, the process may not meet the specification.
Now let us considers that the five measurement data are as shown below
| Measurement | Value |
| 1st Sample | 7.1 |
| 2nd Sample | 7.1 |
| 3rd Sample | 7.3 |
| 4th Sample | 7.5 |
| 5thh Sample | 7.6 |
So, a better matrix is to look into the CpK value rather than Cp. If the CpK is high, that means the process is capable of meeting the required specification.
Difference Between Cp, CpK, and Pp, PpK
The only difference between Cp, CpK, and Pp, PpK is that the Cp/Cpk analysis is done based on sample population whereas Pp/ PpK is done based on total population.
So basically Cp/CpK will give an indication of how the process is but Pp/PpK will show you the actual process capability.
CpK And Equivalent Sigma
| CpK | Equivalent Sigma |
| 1.00 | 3 Sigma |
| 1.33 | 4 Sigma |
| 1.67 | 5 Sigma |
| 2 | 6 Sigma |
Conclusion: Process Capability Index
The process capability index is a very important matrix to evaluate a manufacturer’s capability. It also shows how well a manufacturer can improve manufacturing productivity. The best thing about Cpk is that it can determine how well a company can make a product that meets consumer expectations.
