Stress-Strain Curve represents the behavior of materials when an external force is applied to them. In the real world, every material or body is exposed to external forces.
As product designers, we should know how the part may behave under real-life scenarios when the external force is applied. So in this article, we will learn about the stress-strain diagram of different types of materials and why it is so important.
But before that, we should know about what is stress and what is strain.
What is stress?
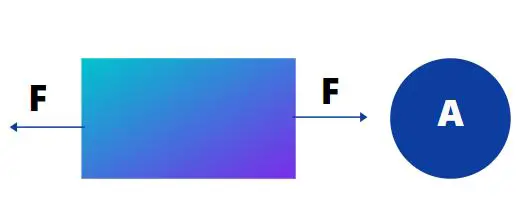
Stress is the internal resistance offered by the material or body when the external force is applied to it. Mathematically, it is the amount of internal resistance force per unit area of the body.
Stress has units of force per area: N/m2 (SI) or lb/in2 (US)
Stress= Resistive force ( F)/ Unit Area {A)

There are different types of stress as shown below.
- Tension Stress
- Compression Stress
- Shear Stress
- Bending Stress
- Torsion Stress
What is strain?
Every material or body elongates or contracts when the external force is applied. Strain the ratio of the amount of deformation due to the stress to the original size.
Strain= Change in length / original length= L1/L
Why Stress Strain graphs are plotted?
No company can afford the failure of its product. Right? Every product designer should check if the part that they have designed can withstand the external forces in a real-life scenario. They use the stress-strain curve for manual calculation and simulation studies.
For example, if a product designer is designing the power button of a computer, then he should check how much force it can tolerate. You can power on a computer with the press of a finger. What if someone hit that power button with a hammer?
Can the power button tolerate that much external force? No. That is why a stress-strain diagram is really important to understand the change of behavior of materials or bodies when the external force is applied.
We should always include the factor of safety along with the stress-strain diagram while designing a part so that there are fewer chances of failure. The factor of safety is the allowable margin to mitigate the risk of failure.
How to check stress and strain on a body?
To check stress and strain you need to use a Universal testing machine ( UTM). It has two claws that hold and put pressure on the test specimen. You need to record any change in the behavior of the body when more and more forces are applied until it is fractured. You also need to record the amount of deformation due to the forces to calculate the strain.

Then you need to plot the behavior of the material or the body on a stress-strain graph where the stress is plotted in the X direction and the strain is plotted in the Y direction. Please note that the stress-strain curve will be different for different materials as every material behaves differently under pressure.
Stress-Strain curve for ductile material
When we talk about the stress-strain curve, we mostly check it with ductile material. Ductile materials show an interesting behavior when under load and that is why it is easy to explain the different terms of the stress-strain curve.

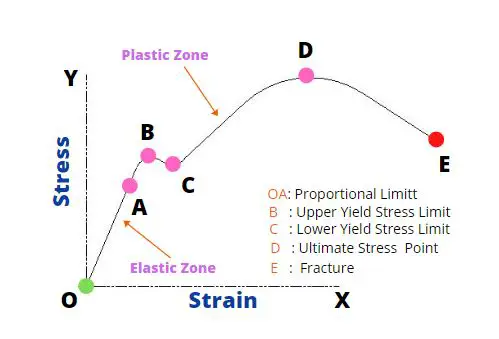
O-A: Proportional limit
Between O to A point, strain is proportional to stress. What that means is that if you put more external force, more strain will occur. In this zone, the part will come back to its original shape if the load is removed. So this area follows the Hookes law that says that the stress is proportional to strain.
O-B: Elastic limit
Between O-B, the materials exhibit elastic behavior, which means if the load is removed the part will come back to its original shape.
Point B: Upper yield point
This is the point after which if you put more pressure, the plastic deformation will start, and elastic deformation will not happen. What that means is that the part won’t come back to its original shape even if the load is removed. There will be permeant deformation.
Point C: Lower Yield Point
This is the point up to which the part will deform with the minimum amount of load. That means this is the minimum load required for plastic deformation.
Point D: Ultimate stress point
Between points C to D, the material or part deforms more against minimum load or pressure. But beyond point D, it can not withstand more load. That is why it is called the ultimate stress point. After point D, necking starts.
Point E: Breaking Point
At point E, the part fails. It can no longer take more load. The load at which the part breaks is called the breaking stress of the material.
Stress-Strain Curve Comparison for Ductile Material, Brittle Material, And Plastic Material
As seen in the stress-strain curve the ductile material goes through elastic deformation as well as plastic deformation when the load is applied until it fractures.
The ultimate stress point and the breaking point are not the same. What that means is that ductile materials can still take some load before they break. Copper and aluminum are some of the ductile material
In the case of brittle, there is no or little elastic or plastic deformation. Brittle materials can not absorb energy from the load. The yield point, ultimate stress point, and breaking point, all are the same in the brittle material. Glass and graphite are some of the brittle materials.
In the case of plastic, initially, it follows the rule of ductile material. The strain is proportional to strain unto a certain load. However, the plastic deformation is very quick and requires very little load. The ultimate strength limit is also very low in plastic material.
Conclusion: Stress-Strain Curve
So that’s all we have in this article. I hope you can learn the basics of the Stress-Strain Curve and why it is so useful for engineers. This is the chart that engineer refers to while shortlisting materials for their products.
There are so many other parameters that they need to consider but the stress-strain curve helps in initial shortlisting.
Do you still have some questions about the stress-strain curve? Please don’t hesitate to ask any query in the comment section and we will be happy to answer
Frequently Asked Questions (FAQ): Stress-Strain Curve
What is a stress-strain curve?
Stress-Strain curve is a graphical representation of Stress and strain when the body or the material is under stress due to external forces
What is the yield point in the stress-strain curve?
The yield point is critical in a stress-strain curve beyond which the plastic deformation of material starts. What that means is that the material won’t come back to its original shape if the load is removed.
what is necking in the stress-strain curve?
After the ultimate stress limit, the local deformation becomes way more than the average deformation which is called necking. Necking leads to fracture when more load is applied.
How to calculate the modulus of elasticity from the stress strain curve?
In a stress-strain curve, up to the elastic limit, the stress is proportional to strain. As we know the modulus of elasticity is equal to stress/strain so we can easily find the value of modulus of elasticity by using this formula.